Loading your cluster#
Your cluster’s data needs to be stored in a file format compatible with the pandas package. The csv format is probably the most used but any compatible format is acceptable.
The first step is to load the file as a pandas DataFrame:
import pandas as pd

# Read the cluster's data file with pandas
df = pd.read_csv("path_to_cluster_file")
After this, you can define a cluster object (see: asteca.cluster)
simply by passing the dataframe and the the column names in your data file for the IDs,
right ascension, declination, magnitude, color, and their respective uncertainties.
import asteca

# Generate a `cluster` object
my_cluster = asteca.cluster(
    cluster_df=df,
    source_id='Source',
    ra='RA_ICRS',
    dec='DE_ICRS',
    magnitude="Gmag",
    e_mag="e_Gmag",
    color="BP-RP",
    e_color='e_BP-RP'
)
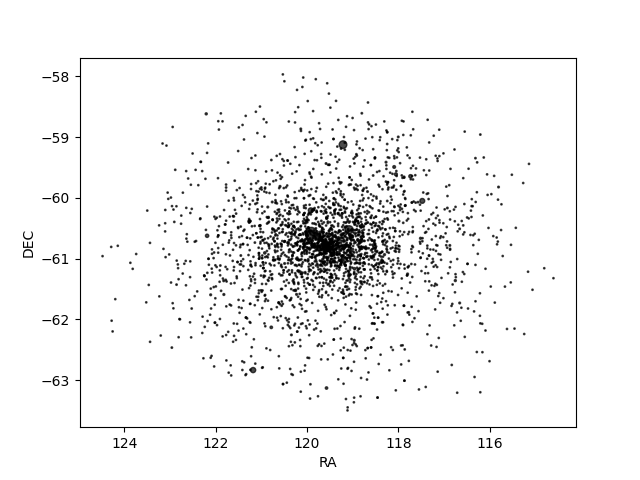
That’s it! You can now for example generate a quick coordinates plot with the
radecplot() method:
import matplotlib.pyplot as plt

ax = my_cluster.radecplot()
plt.show()
showing something like:
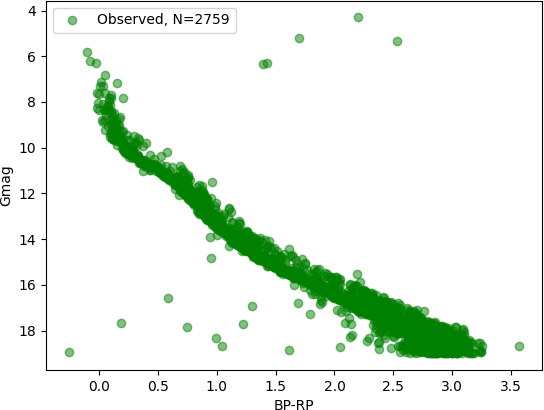
or a color-magnitude plot with the cmd_plot() method:
import matplotlib.pyplot as plt

ax = my_cluster.cmdplot()
plt.show()
which should results in something like this: